
Bourbon market trends in 2026 reveal a market that looks considerably different from the one collectors experienced during bourbon’s boom.
But there’s a problem with saying simply that bourbon prices are falling.
Not every bottle is falling. Not every segment is experiencing the same pressure. And the bottles commanding the highest prices aren’t necessarily the ones delivering the strongest performance.
At Bourboneur®, we’ve spent years building the Bourbon Blue Book®, which now tracks nearly 15,000 bourbons using retail pricing from across the United States and observed secondary-market transactions.
That growing database gives us an opportunity to examine the bourbon market beyond individual releases, auction headlines, and anecdotal pricing.
For this study, we analyzed 8,333 bottles with comparable published valuations at both the beginning and end of a 365-day period ending November 8, 2026.
The results reveal a market experiencing downward pressure, but not uniformly. Some segments have held relatively steady, others have declined considerably, and the patterns have shifted over time.
Here’s what the data tells us.
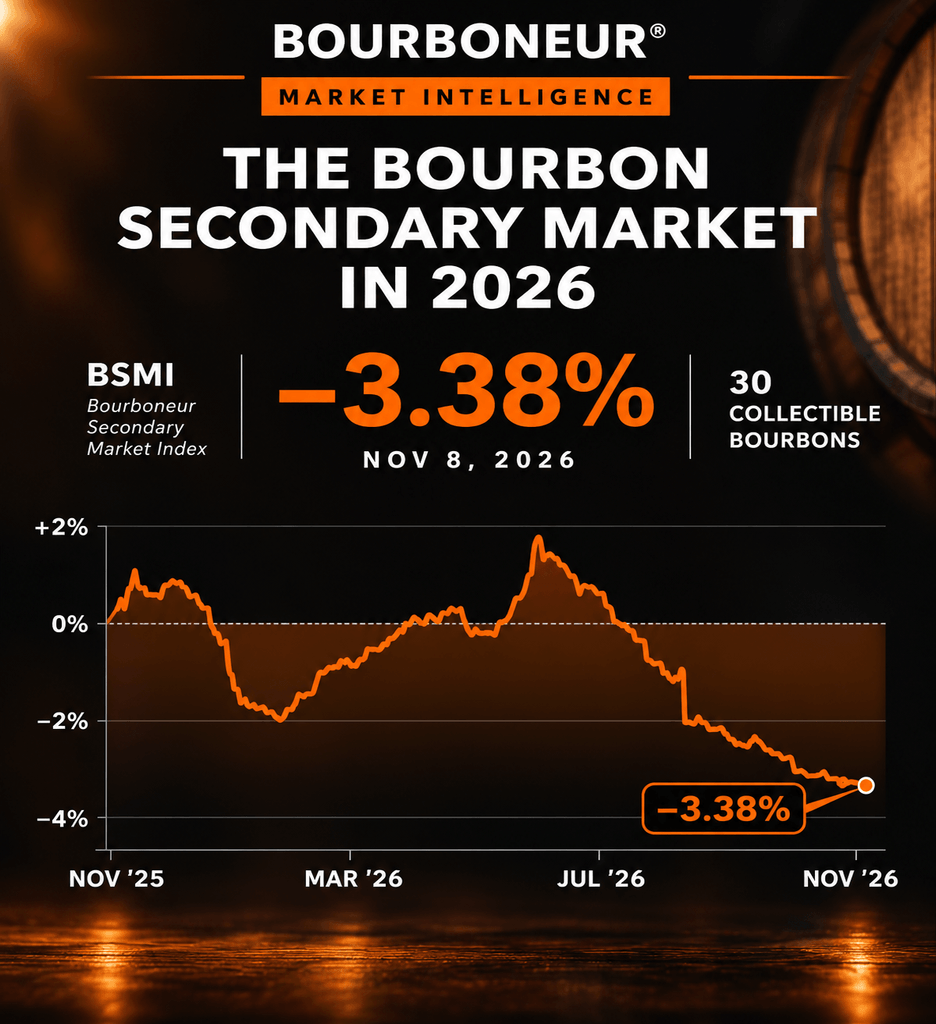
The Bourboneur Secondary Market Index (BSMI) tracks a defined basket of 30 collectible bourbons, providing a benchmark for understanding changes in the secondary market.
As of November 8, 2026, the BSMI reported a decline of 3.38% on its displayed performance measure.
That reflects continued pressure on collectible bourbon valuations.
But the BSMI tells only part of the story.
Unlike the index, which focuses on a defined basket of collectible bottles, the Bourbon Blue Book® encompasses a much broader universe. Widely available bourbons are often informed by retail pricing, while allocated and collectible releases rely more heavily on secondary-market activity.
Our analysis of 8,333 individually matched bottles found an average one-year valuation decline of 2.10%.
The BSMI and broader Blue Book analysis measure different populations using different approaches. Their results aren’t directly interchangeable, but together they provide valuable context.
The more interesting question isn’t simply whether the market is declining. It’s where that pressure is being felt.
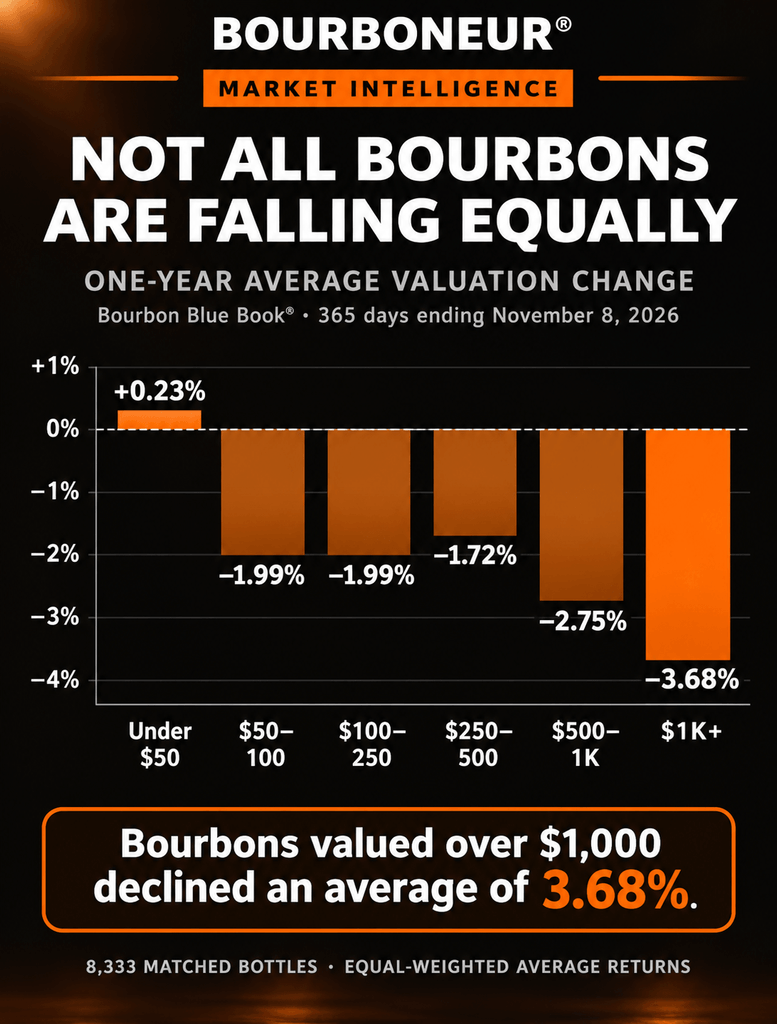
To better understand bourbon market trends in 2026, we divided bottles into six categories based on their starting Blue Book valuations.
The differences were significant.
Bottles valued below $50 were essentially flat, increasing an average of just 0.23% over the year.
At the opposite end of the spectrum, bourbons valued above $1,000 declined an average of 3.68%, making them the weakest-performing category in the analysis.
Between those extremes, bottles valued from $50 to $500 generally declined between 1.7% and 2.0%, while those in the $500–$1,000 category fell an average of 2.75%.
The contrast is important.
Widely available bourbons are often priced through retail channels, where pricing dynamics differ from those of collectible releases. Higher-value bottles, meanwhile, can be more exposed to changing collector demand and the premiums buyers are willing to pay.
Price alone doesn’t determine whether a bottle’s valuation is retail-informed or secondary-market-informed. Still, the results illustrate how differently various segments can behave.
And while the relationship between price and performance isn’t perfectly linear, the broader finding is difficult to ignore.
The highest-priced category experienced the greatest average decline over the past year.
For collectors who accumulated expensive bottles during the market’s strongest years, that’s a meaningful change.
A bottle that commanded $800 last year isn’t necessarily worth $800 today. And an asking price isn’t always an accurate reflection of the broader market.
Before your next purchase or trade, check the Bourbon Blue Book® to understand what current pricing evidence suggests.
Average returns tell only part of the story.
Across the 8,333 bottles analyzed, 36.3% finished the year with lower published valuations, compared with 14.9% that finished higher.
Among bottles valued above $1,000, the difference was even more pronounced: approximately 43.6% declined, while just 12.9% appreciated.
In the highest-priced category, declining bottles outnumbered appreciating bottles by more than three to one.
These findings are based on published valuations at two points in time, rather than the number of underlying transactions or valuation updates. The Blue Book continuously incorporates new pricing information, and individual valuations reflect the available market evidence.
The takeaway is the direction of pricing movements, particularly among premium collectibles, where declines substantially outnumbered gains.
The annual results establish which segments experienced the greatest pressure over the past year.
But the most recent 90 days reveal a different pattern.
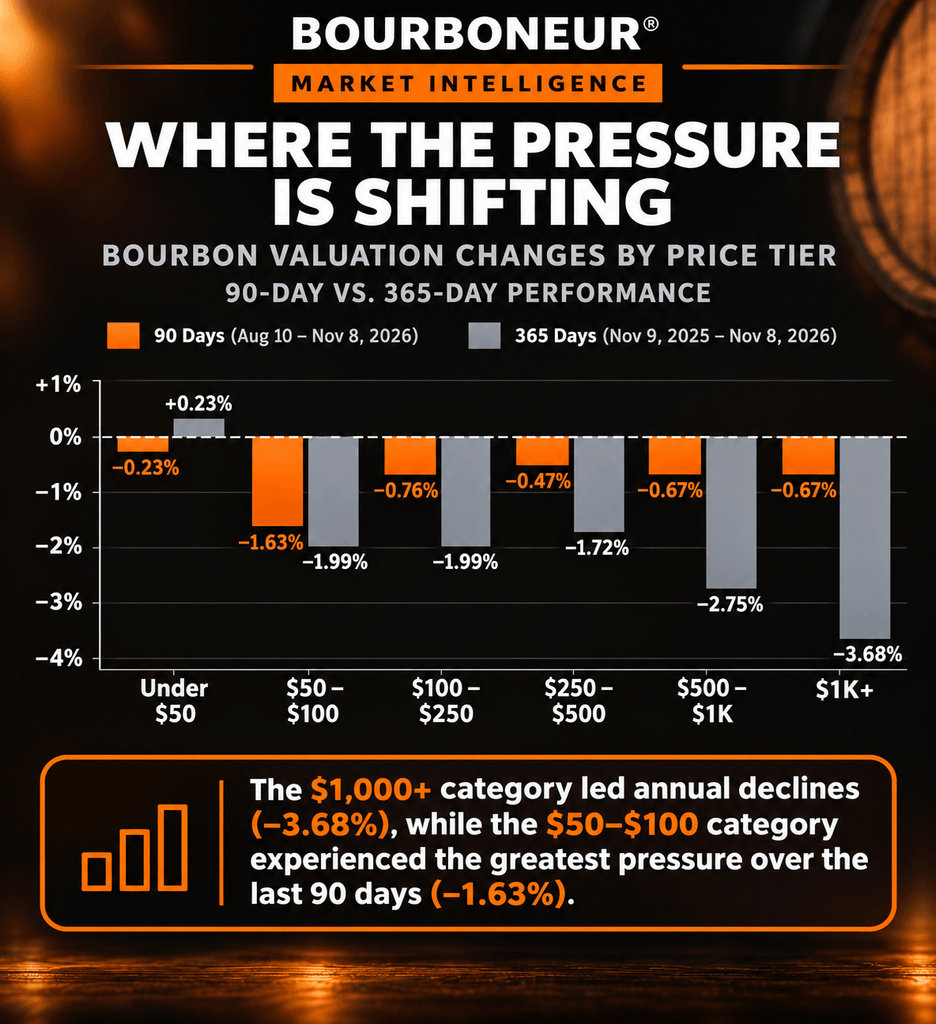
While bottles valued above $1,000 experienced the largest average annual decline, the $50–$100 category recorded the greatest decline over the shorter period, falling 1.63%.
Meanwhile, the $1,000-plus category declined an average of just 0.67% over those 90 days.
That doesn’t establish that premium bourbon prices have reached a bottom, nor does it mean a sustained recovery is underway.
The two timeframes measure cumulative changes over different durations, so they shouldn’t be interpreted as equivalent annualized returns.
What they do reveal is that the distribution of pricing pressure has shifted.
The category experiencing the greatest declines over the full year isn’t necessarily the one experiencing the greatest pressure most recently.
For collectors, that’s another reason to look beyond historical averages when evaluating an individual bottle.
The market may be declining, but that doesn’t mean every bottle in your collection is losing value. Some are appreciating, others are falling, and yesterday’s prices may no longer reflect today’s market.
The price you paid, the price someone is asking, and the value supported by current market evidence are three different things.
That’s why the Bourbon Blue Book® matters. With nearly 15,000 bottles tracked, it provides the pricing intelligence to make more informed buying, selling, and trading decisions.
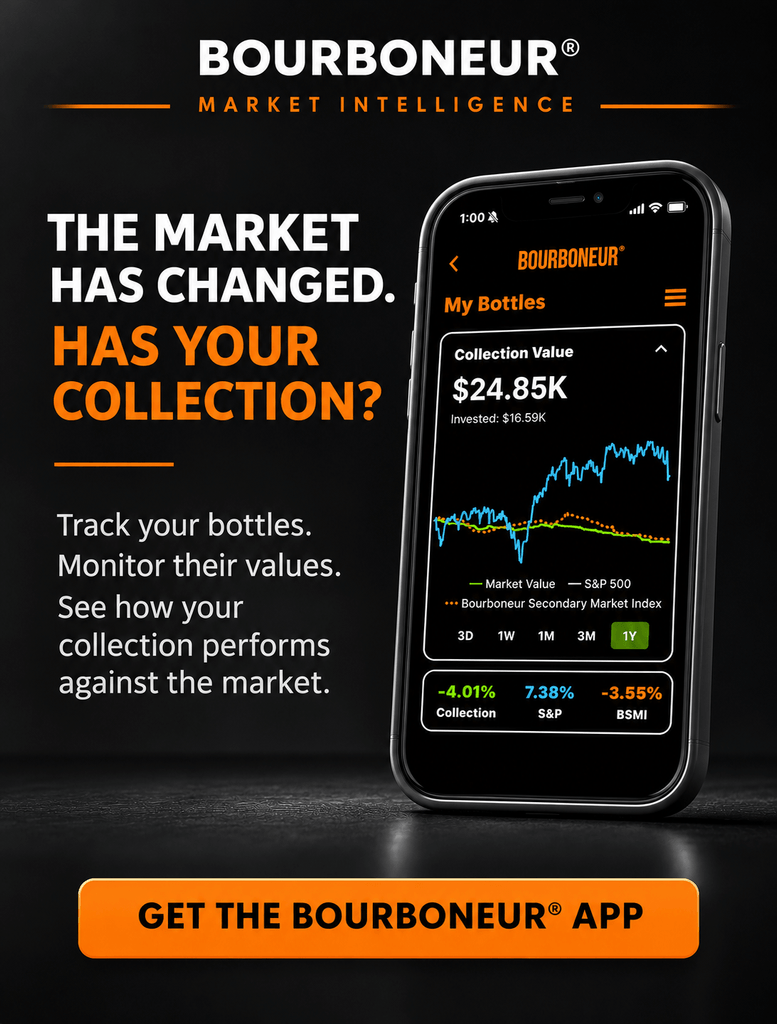
And with the Bourboneur app, you can track your collection’s value and compare its performance against the BSMI and S&P 500.
The latest bourbon market trends in 2026 reinforce a central finding: pricing pressure isn’t affecting every bottle equally.
Our analysis of 8,333 bottles shows that the broader pricing environment remains under pressure, with the most expensive bourbons experiencing some of the greatest average declines over the past year.
But the findings also demonstrate why sweeping statements about the bourbon market can be misleading.
Different price categories behave differently. Short-term trends don’t always mirror longer-term performance. And individual bottles can move in opposite directions, even when the broader market is declining.
For collectors, the takeaway isn’t necessarily to buy, sell, or hold.
It’s to understand the market you’re participating in.
Because the question isn’t simply whether bourbon prices are falling. It’s which bottles are falling, by how much, and how your own collection compares.
The Bourbon Blue Book® tracks nearly 15,000 bourbons using retail pricing from stores across the United States and observed completed secondary-market transactions. Widely available bottles are generally informed by retail pricing, while collectible and harder-to-find releases are informed by secondary-market activity.
This study examined 8,333 individually matched bottles with published average valuations at both the beginning and end of the 365-day period ending November 8, 2026.
Bottles were grouped by their starting valuations, with each bottle receiving equal weight in calculating average percentage changes. The 90-day analysis was calculated separately using the corresponding shorter measurement period.
Bottles without comparable valuations at both endpoints were excluded from the relevant comparison. Consequently, the findings describe matched historical cohorts rather than every bottle currently listed in the Blue Book.
The Bourboneur Secondary Market Index (BSMI) separately tracks a defined basket of 30 collectible bourbons. Its composition and methodology differ from those of this broader analysis.
The findings measure changes in published Blue Book valuations rather than individual transaction prices, sales volumes, or the frequency of valuation updates.
Source: Bourboneur Bourbon Blue Book® historical pricing archive and Bourboneur Secondary Market Index. Data through November 8, 2026.
Learn more about how Bourbon Blue Book valuations are developed.